Happy birthday, NOLS Rocky Mountain solar array!
The NOLS RM solar array marked its first birthday earlier this winter. However, in the “data digital world” it turns one today! One year ago, we officially began collecting data on-line. Click here to check out the live solar stats– scroll to the bottom of the page.
Looking back at 2008, what did we learn? The solar array doesn’t need much of our attention. Other than checking the rack system a couple of times, resetting one inverter error, and shoveling snow off the panels in the winter, the maintenance was minimal.
For all you visual learners and data crunchers out there, below is a basic snapshot graph that charts our net electricity usage for 2007 and 2008. (In 2008, we accounted for both the energy produced by our solar array, and the energy returned to the electricity grid.)
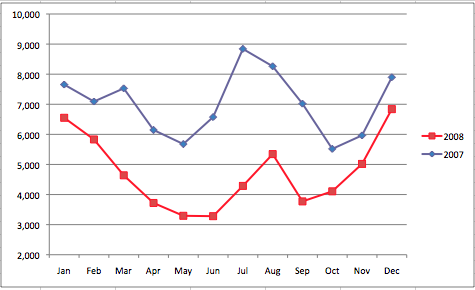
On the graph, the numbers on the “Y” axis represent kilowatt hours (kWh), and the “X” axis represents calendar months. As you will notice, our energy consumption and solar energy production varies throughout the year. In the peak of summer 2008, we used 50% less electricity from the electrical grid as compared to 2007 at the same time. Interestingly, our kWh usage during the 2008 winter months was similar to that of 2007. If you average the kWh’s in both years, we consumed 35-40% less energy from the electricity grid in 2008 than 2007.
What does this all mean? We believe it means that our habits are changing, our building improvements are making a difference, we are reducing our energy usage overall, and mostly, our solar array is producing energy!
(We’ll continue to collect historical data, and report periodically on our findings.)
Special thanks to Steve and Terry!
Topics: